In the previous post for our Micro Charts product (currently available for WPF, Silverlight, and WinRT XAML), we finished looking at our heat map control that is able to generate heat map markers that change both in size and color. This allows for representations of two distinct data sets in the same heat map.
In today's post, we'll take a look at a new control called MicroBulletGraph coming to Micro Charts in the WPF and Silverlight controls in their 2012.2 versions. This control is already available in the WinRT XAML 2012.2 version of Micro Charts.
UPDATE: Version 2012.2 is live and available for download now.
What Are Bullet Graphs?
Bullet graphs were originally designed to replace meters and gauges in a more compact way while still being informative. They are best suited to display a value that has other related values to be compared to, such as last year's mark, a goal or target, or a projected future value. With the MicroBulletGraph's many parts, it is easy to provide contextual information about the data being displayed.
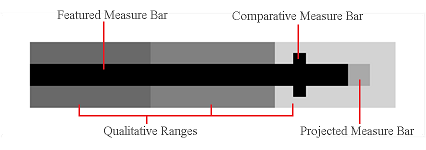
The actual value is represented by a featured measure bar, which is juxtaposed with a comparative value displayed as a bar perpendicular to it. The featured and comparative values are then placed in the context of specific ranges such as poor, average, and excellent. To give further meaning a projected bar can be used to display a future expected value of the featured bar.
In the example above all the parts of the MicroBulletGraph are displayed and labeled. Note that the only required value is the featured value, all others can be omitted, hiding the bar from view. An unlimited number of ranges can be used, or none at all, but bullet graphs most commonly utilize three qualitative ranges.
Summary
Bullet graphs are incredible tools to help the viewer grasp multiple points of information quickly without seeming cluttered or confusing.
In our next post of this series, we'll take a look at appearance customization features.


